Course Outline
-
segmentGetting Started (Don't Skip This Part)
-
segmentStatistics and Data Science: A Modeling Approach
-
segmentPART I: EXPLORING VARIATION
-
segmentChapter 1 - Welcome to Statistics: A Modeling Approach
-
segmentChapter 2 - Understanding Data
-
2.5 Measurement (Continued)
-
segmentChapter 3 - Examining Distributions
-
segmentChapter 4 - Explaining Variation
-
segmentPART II: MODELING VARIATION
-
segmentChapter 5 - A Simple Model
-
segmentChapter 6 - Quantifying Error
-
segmentChapter 7 - Adding an Explanatory Variable to the Model
-
segmentChapter 8 - Models with a Quantitative Explanatory Variable
-
segmentPART III: EVALUATING MODELS
-
segmentChapter 9 - The Logic of Inference
-
segmentChapter 10 - Model Comparison with F
-
segmentChapter 11 - Parameter Estimation and Confidence Intervals
-
segmentPART IV: MULTIVARIATE MODELS
-
segmentChapter 12 - Introduction to Multivariate Models
-
segmentChapter 13 - Multivariate Model Comparisons
-
segmentFinishing Up (Don't Skip This Part!)
-
segmentResources
list College / Advanced Statistics and Data Science (ABCD)
2.5 Measurement (Continued)
Variable versus Value
It is important to distinguish between the variable (e.g., Height or Sex or FamilyMembers) and the value or number we assign to each object in the sample (e.g., 62, for height in inches, or 2 to represent female). One variable can take on many different values.
The fewest unique values a variable can take on would be two: the presence (1) or absence (0) of some characteristic. For example, a variable may be coded 1 if someone is a college graduate, or 0 if they are not. If a variable could only take on one possible value, there would be no variation and hence it’s not really a variable. It’s possible, however, for quantitative variables to take on an infinite number of possible values.
When we code the values of a variable using numbers, it is always important to keep in mind what the numbers mean. The value 2 has a very different meaning if it represents the sex of a person (e.g., male) than if it represents their height in inches (very short!). When we use statistical software to analyze data, the software processes the numbers. But the software doesn’t know what the numbers actually mean. Only you know that.
Let’s take a look at just the variable Sex in the Fingers data (download Fingers data frame documentation (PDF, 57KB)). Remember, in R, to access just one variable we first specify the data frame it comes from (Fingers), and then use the $ symbol before specifying the variable name (Sex).
Fingers$Sex [1] 2 1 1 2 2 2 2 2 1 1 2 2 1 2 1 1 2 2 1 2 1 1 1 2 1 1 2 2 1 2 1 2 1 1 1 1 1
[38] 2 1 2 1 1 2 2 1 1 1 2 1 1 1 2 1 1 2 1 2 1 1 2 1 1 1 2 1 2 2 2 2 2 2 2 2 2
[75] 1 2 1 1 2 1 1 1 1 2 2 2 1 2 1 1 1 2 1 2 1 2 1 2 2 2 2 1 1 1 2 2 1 1 2 1 1
[112] 2 2 2 2 1 2 2 2 2 2 2 1 1 1 2 1 2 2 1 1 1 2 2 2 1 1 2 1 1 1 2 2 2 1 1 1 2
[149] 1 2 2 2 2 1 1 1 2Measurement Error
Finally, to round out our introduction to measurement, it is important to note that measurements usually include error. Let’s say two people measure the same thumb. One person insists that the thumb they measured was 56 mm but the other person says it was 57 mm long. Which is it? 56 or 57 mm? The true length is probably somewhere in between. This kind of variation is called measurement error, which refers to the fact that measurements might be off a little, plus or minus, from the true value.
Measurement error is not the same thing as a mistake. For example, if one student measured the thumb in centimeters when they were supposed to measure in millimeters, that would be a mistake. But measurement error is different. Even when we are doing our best to get an accurate measurement it will often be off by a little bit. Most measurements include some measurement error.
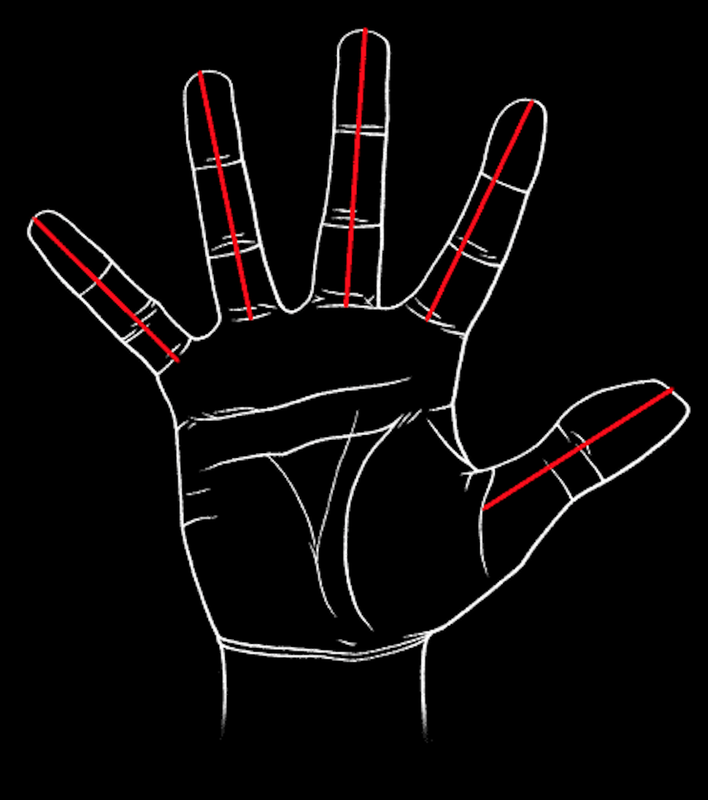
Measurement error can happen for many reasons. Some people might include the width of the crease between the thumb and palm in their measurement of thumb length (see figure below) whereas other people might not. Maybe one student used a rigid ruler while the other used a tape measure. The lighting in the room might have been different for the two students.
Some measures will contain more error than others. Height and thumb length are fairly easy to measure, but what if you want to measure depression, intelligence, health, and so on? These are important things to find out about, but can be very difficult to measure. Things that are hard to measure will usually have more measurement error.
Even though a measurement might contain error, this does not necessarily mean it is biased. Error just means that there is variation in the measure even though we know that the thing being measured does not vary. If 10 people get different measurements of the same person’s thumb, we assume it’s the measurements that vary, not the length of the thumb. A measure is unbiased if the error is just as likely to be too high as too low, thus balancing out error around the true value.
But measurement can also be biased. A biased measure is systematically too high or too low. The error does not vary randomly around the middle, but pulls the measurement one way or the other. For example, if the 10 people who measured the same thumb all rounded up to the next mm, this would bias all the measurements to be slightly bigger than the actual length of the thumb. Contrast this with unbiased error: some people rounded down and some people rounded up and some people didn’t round at all. Even though these measurements would also have error, they would have unbiased error. This is something to keep in mind later as you analyze the data that is produced by the measures.