Chapter 7 - Adding an Explanatory Variable to the Model
7.1 Explaining Variation
Having started with the empty model, you may be feeling frustrated. Statistics, we have said, is about explaining variation. But in what sense have we explained variation with the empty model? Yes, the mean is the point in the distribution that reduces the sum of squares to its lowest point. But surely that doesn’t count as explanation!
Indeed it does not! We started with the empty model in order to get some important ideas across, but certainly that’s not where we want to end up. It is time we start building models that include explanatory variables. We will still use the empty model, but only as a reference point.
Let’s start by reviewing what we mean by explaining variation. Earlier in the course, we developed an intuitive idea of explanation by comparing the distribution of one variable across two different groups. So, for example, we looked at the distribution of thumb length broken down by sex, which we can see in the two density histograms below.
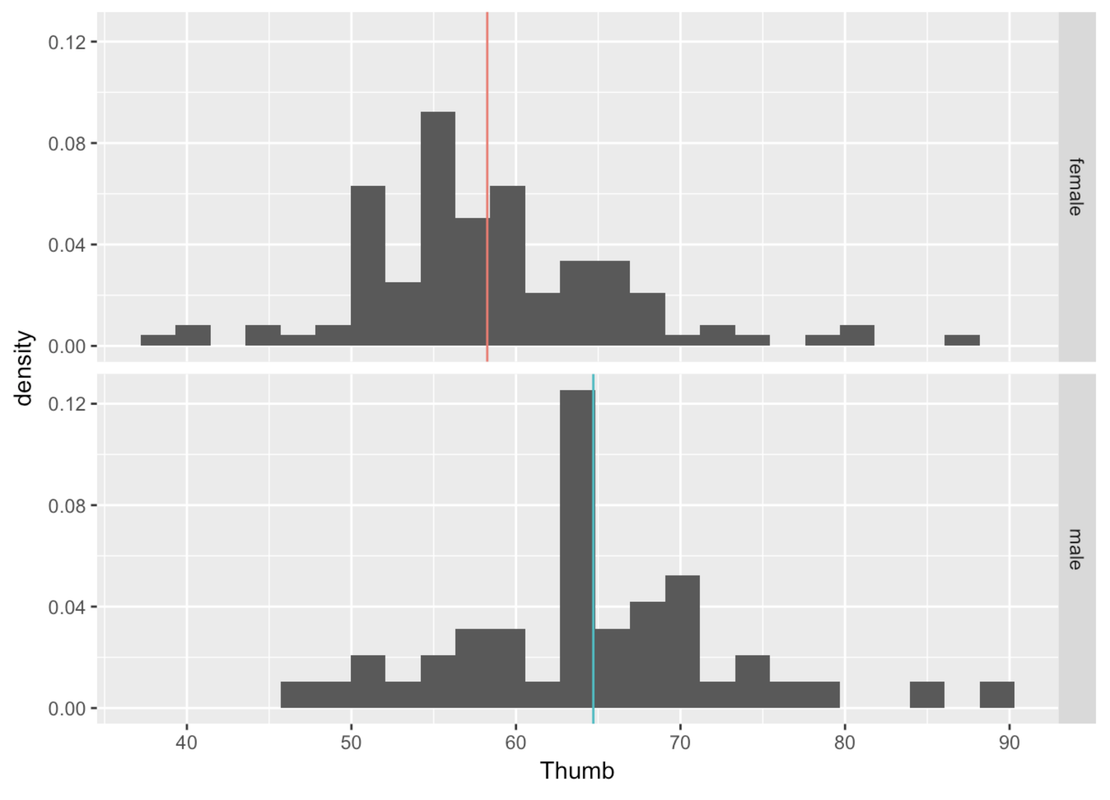
You can clearly see that sex explains some of the variation in thumb length in our data. (This may not be true in the Data Generating Process, of course. It’s always possible that we are being fooled by a sample that doesn’t accurately represent what’s true in the DGP.) When we break up thumb length by sex it looks like two separate, though overlapping distributions. In general, males have longer thumbs than females in our data.
If we assume that this relationship (between sex and thumb length) exists in the population (or DGP), and not just in our data, we can use it to help us make a better prediction about a future observation. If you know that someone is male, you would make a different prediction of their thumb length than if you knew they were female.
Earlier in the course we expressed this idea in a word equation like this:
THUMB LENGTH = SEX + ERROR
What this says, is: sex explains some of the variation in thumb length, but other things also affect thumb length.
Building on the previous section, let’s now try to state this relationship more precisely (that is, quantitatively) as a statistical model.