4.3 Outcome and Explanatory Variables
We now have a sense of what it means to explain variation in one variable by variation in another. In the previous section, for example, we saw that variation in thumb length could be explained, in part, by variation in sex. In this section we want to begin developing a language for describing the variables that play different roles in these relationships—relationships in which one variable explains variation in another.
Up to this point, we have distinguished between categorical variables and quantitative variables. But our desire to explain variation in one variable with variation in another variable leads us to make another distinction, that is, between an outcome variable and an explanatory variable.
The outcome variable is the variable whose variation we are trying to explain.
In this course, the tools and methods we use will focus on a single outcome variable at one time.
The explanatory variables are the variables we use to explain variation in the outcome variable. Although we will initially consider only one explanatory variable at a time, later in this course we will allow for the possibility of using multiple explanatory variables at a time.
You may or may not have heard the terms “outcome variable” and “explanatory variable”. We will use these terms throughout, but if you’ve taken statistics before, or read any research reports, you will no doubt have encountered a number of different terms used to represent the same distinction. Some of these are presented in the table below.
| Outcome Variable | Explanatory Variable |
|---|---|
| Dependent variable (DV) | Independent variable (IV) |
| Predicted variable | Predictor variable |
| Response variable | Treatment variable |
| Output variable | Experimental variable |
| Factor |
It is important to figure out whether a variable is quantitative or categorical. But it is equally important to figure out whether a variable is an outcome or explanatory variable. Making this latter distinction requires a greater understanding of the context that the data pertain to, and the purpose for collecting the data. Let’s think about a situation and try to figure out what the outcome variable might be.
In the MindsetMatters data frame, we have the results of an experiment where a researcher informed a randomly chosen group of housekeepers (41 of them) that the work they do satisfies the Surgeon General’s recommendations for an active lifestyle (which is true). They were also given examples to illustrate why their work is considered good exercise. The other 34 housekeepers were told nothing.
Whether an individual housekeeper was informed or not was recorded in the variable called Condition (either Informed or Uninformed). The researcher also recorded whether each housekeeper lost weight or not after four weeks in a categorical variable called WtLost (either lost or not lost). The first six rows of the data frame for these two variables are shown below.
head(select(MindsetMatters, Condition, WtLost)) Condition WtLost
1 Uninformed not lost
2 Uninformed lost
3 Uninformed not lost
4 Uninformed lost
5 Uninformed lost
6 Uninformed not lostWrite some code to examine the distribution of the outcome variable.
require(coursekata)

MindsetMatters <- Lock5withR::MindsetMatters %>%
    mutate(WtLost = ifelse(Wt2 < Wt, "lost", "not lost"))
# Write code to make the most appropriate visualization for the outcome variable
gf_bar(~WtLost, data = MindsetMatters)
ex() %>% check_function("gf_bar") %>% {
    check_arg(., "object") %>% check_equal(incorrect_msg = "Did you specify the outcome variable `~WtLost`?")
    check_arg(., "data") %>% check_equal(incorrect_msg = "Did you call `gf_bar()` with the `MindsetMatters` data set?")
}
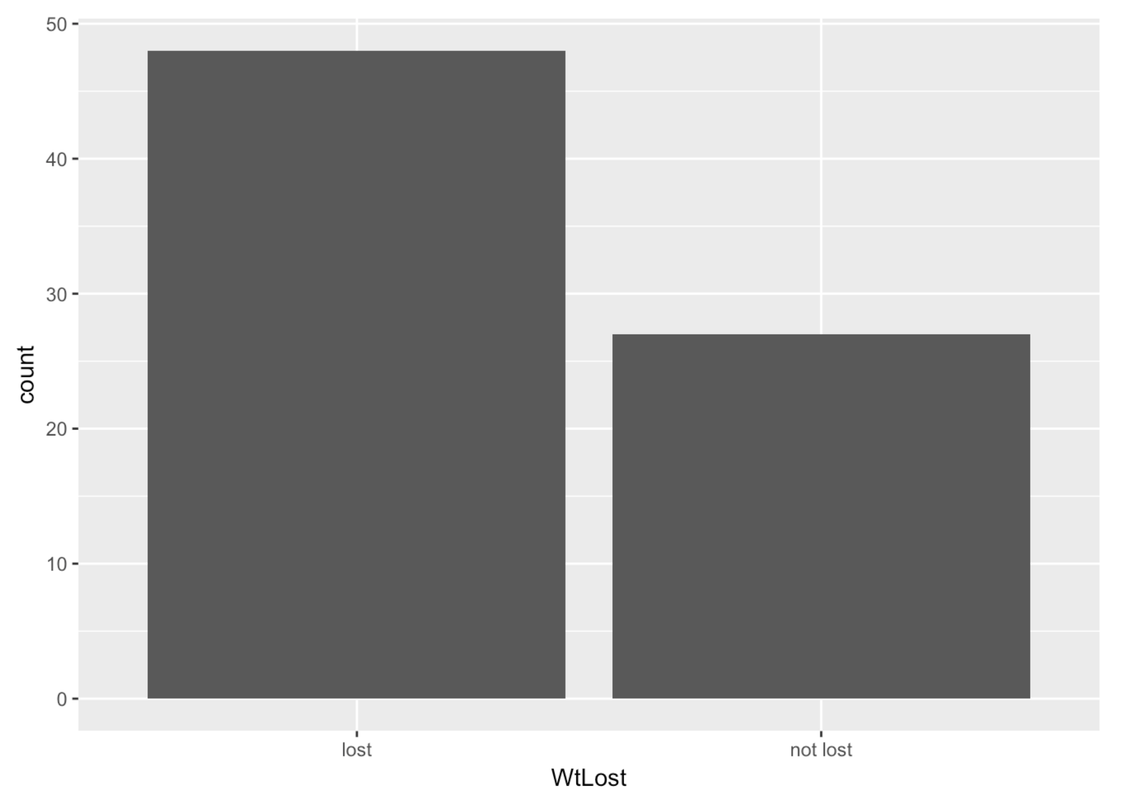
We’ve used a bar graph to visualize the distribution of WtLost (gf_bar()).
You can use gf_facet_grid() with any plot, not just histograms. Try creating a bar graph of WtLost (like the one above), but chain on a facet grid to compare the outcome across conditions.
require(coursekata)

MindsetMatters <- Lock5withR::MindsetMatters %>%
    mutate(WtLost = ifelse(Wt2 < Wt, "lost", "not lost"))
# Create a bar graph of WtLost, then use gf_facet_grid() to compare the outcome across conditions
gf_bar(~WtLost, data = MindsetMatters) %>%
    gf_facet_grid(Condition ~ .)
ex() %>% {
    check_function(., "gf_bar") %>%
        check_result() %>% check_equal()
    check_or(.,
        check_function(., "gf_facet_grid") %>%
            check_result() %>% check_equal(),
        check_function(., "gf_facet_grid") %>%
            check_arg("object") %>% check_equal()
    )
}
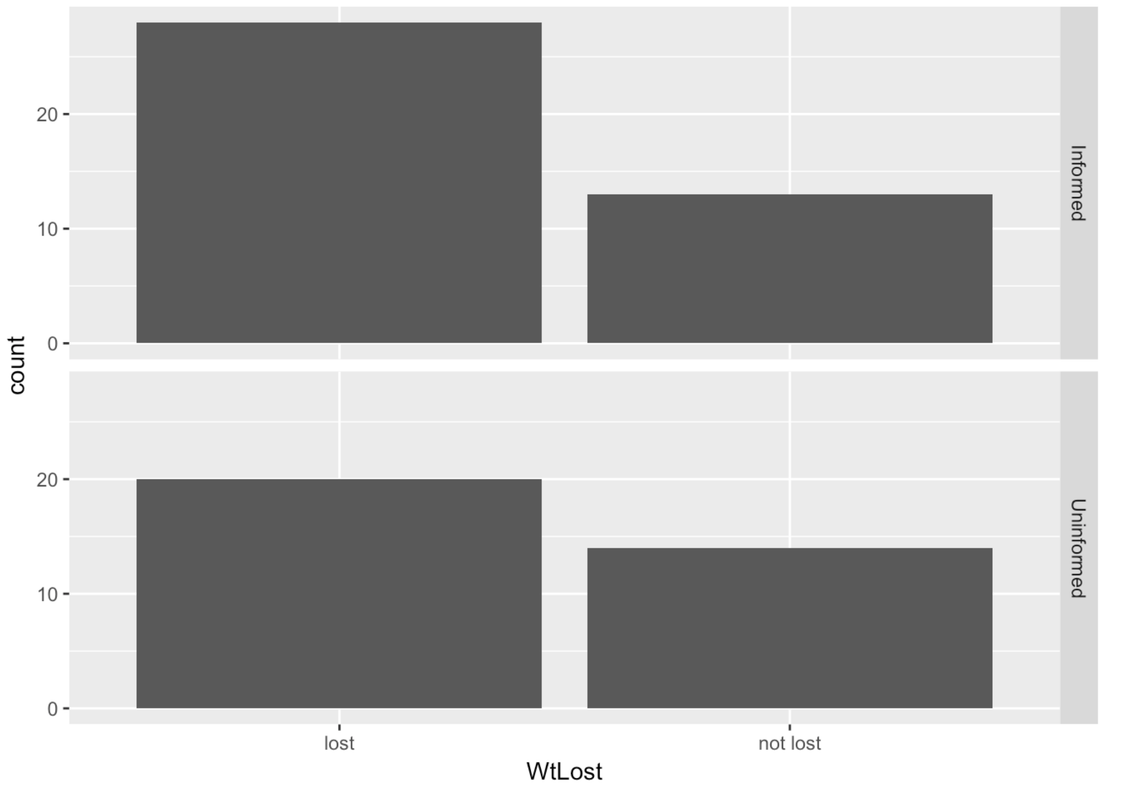
There is a real limitation in this graph. Because the sample sizes are different between the two groups, you have to look at the relative difference in percentage of housekeepers who lost weight between the two groups, mentally controlling for the difference in sample size. If these were histograms, we would just use a density histogram instead. But R doesn’t make it easy to do this for bar graphs.
A better way to make the comparison using relative frequencies is just to use the tally() command. Here’s some code that would give us a more easily interpretable comparison:
tally(WtLost ~ Condition, data = MindsetMatters, format = "proportion") Condition
WtLost Informed Uninformed
lost 0.6829268 0.5882353
not lost 0.3170732 0.4117647So far we have considered both quantitative (e.g., Thumb) and categorical (e.g., WtLost) outcomes. We have also looked at some categorical explanatory variables (e.g., Sex and Condition). But we haven’t yet looked at any examples of quantitative explanatory variables.
But there isn’t any reason to think that we couldn’t. Perhaps a quantitative variable like age or initial weight might help us predict how much weight a housekeeper will lose. We’ll come back around to the idea of a quantitative explanatory variable later.
In summary, the key difference between whether a histogram or a tally will be more useful has to do with the type of outcome variable.