Chapter 9 - Distributions of Estimates
9.0 The Concept of Variation in Estimates
Up to now we have built models, based on data, to help us understand the Data Generating Process (DGP). For example, we have taken a sample of data, computed the mean of a variable, and used that mean as an unbiased estimate of the mean of the population.
We know these models are wrong. We know this because there is variation left over from the model, variation that we cannot explain. We have squeezed the error variation down as far as we can. And we have a good sense of how much error variation there is. We can measure it (using SS, variance, or standard deviation), and get a sense of how much error there is around the model.
But these estimates are also affected by another kind of variation—sampling variation. We made the best estimate of the population parameter we could based on our sample of data. But if, just by random sampling, we had ended up with a different sample, our estimate of the mean would be different.
Variation in individual scores around a mean is something we can see by making a histogram of our data. But variation in an estimate from sample to sample is something we generally can’t see at all, primarily because we only have one sample. We know there is sampling variation, but it’s not easy to gauge how much sampling variation there may be.
Take, for example, the variation in thumb lengths in our sample of 157 students (see figure below). Our empty model is indicated by the blue vertical line: the mean is 60.1 mm. We know this is the best estimate we can make of the mean of the population, but we can clearly see how imperfect it is.
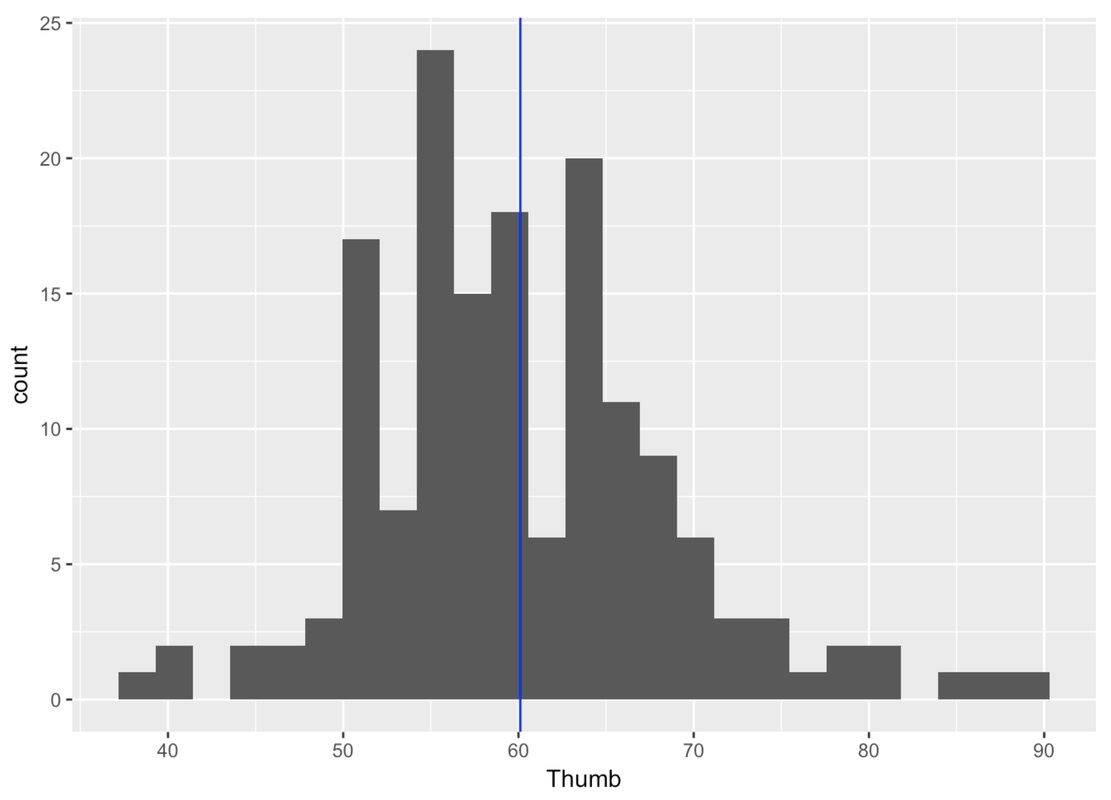
But what about error in the estimate of the mean itself? We only can see one mean in this histogram. Yet, we know that it is just one of many possible means we could have found if we had taken different samples. This is what we want to find out in this chapter: Not just how far off the mean is as a model of our particular sample, but how far off the mean is as an estimate of the population mean.
In this chapter we will introduce the concept of sampling distribution, which is the distribution of an estimate across many possible samples. We will start by exploring the problem of sampling variation in estimates. We then introduce sampling distributions as a solution, show you how to make one, and finally how to use one to ascertain the accuracy of statistical models.