10.6 Interpreting Confidence Intervals (Continued)
Distributions of Means Versus Individual Scores
It is important to remember that the confidence interval (CI) is about means, not individual scores. So, although the confidence interval is likely to include the true population mean, that does not mean that 95% of the individual scores would fall within this interval.
Let’s say that, instead of the CI of means, we wanted to figure out the range of thumb lengths that would capture 95% of the population. In this case we would need to have a sense of the whole population of thumb lengths, and then figure out the boundaries for the middle 95%.
Think back to the simulations we looked at to understand the Central Limit Theorem (CLT). Recall that populations were always more variable than sample means (except in the special case where n=1). After all, sample means are “middles”, and the middles will cluster together more than individuals. It is more likely for an individual person to have a longer-than-average thumb, than for a random sample of 157 people to all have longer-than-average thumbs?
When we are trying to find out about the likelihood of individuals falling within a given range, we could use a normal distribution to represent the whole population, and use \(\pm 2 * \sigma\) to represent the 95% of individuals closest to the population mean (\(\mu\)).
Remember, sample means usually vary less—and thus sampling distributions are less variable—than the populations they come from. The same reasoning is important to keep in mind as we consider how likely it would be that a single randomly selected person would have a score outside the 95% confidence interval. The 95% confidence interval is based on the sampling distribution of means, but to estimate the likelihood of an individual, we should base our reasoning on a hypothetical population distribution of individuals.
Keeping all this in mind can be difficult to do. We find that it helps to keep asking yourself: which distribution do I need to use to answer the question? Questions about individuals usually need to be answered in reference to the population distribution; questions about means usually require reference to the sampling distribution of means.
95% Chance of What?
It is true that if you had to pick one number, the sample mean would be your best, unbiased estimate of the mean of the population. However, the probability that the mean of the population would be this exact number is essentially 0. There is always some fluctuation in an estimate because estimates are based on a small bit of the bigger picture.
The mathematically smooth normal curve, which we use to model the error in our estimate, is a probability distribution. The area under the curve adds up to a probability of 1. So, probabilities are associated with regions of the curve, not specific points on the curve. We could say that there is a .50 probability that the sample mean is greater than the mean of the population. But we cannot say that there is a .50 probability that the sample mean is exactly equal to the mean of the population.
Also whenever you hear about a chance or probability, it’s a good idea to ask: What is the 100% or “whole”? And what part of the whole does the 5% refer to?
Other Levels of Confidence
The 95% confidence interval is probably the most common variant of the confidence interval. But the decision to accept 95% as the confidence level—or .05 as the error rate—is purely arbitrary. Sometimes we want to be more confident in our estimate, and we may calculate a 99% confidence interval. Other times we may be happy with a 90% confidence interval.
The higher the confidence required, the larger the interval will have to be. Let’s think through the reason for this.
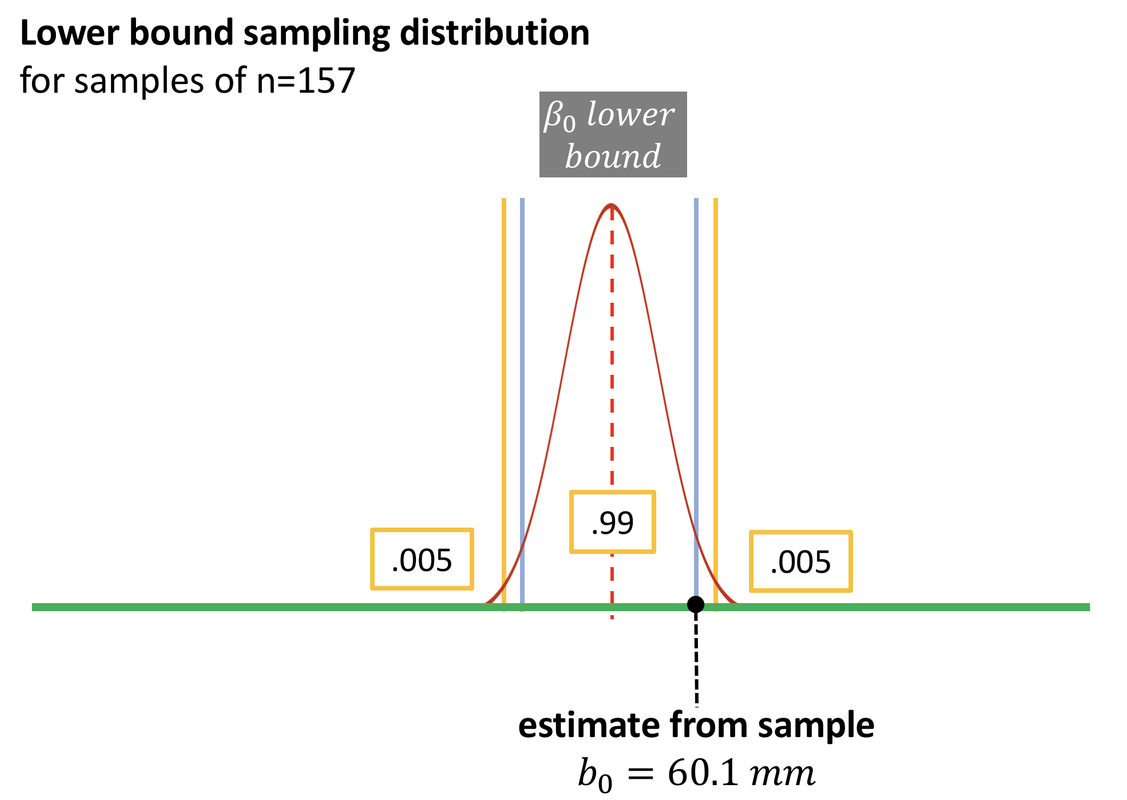
Recall that to construct the 95% confidence interval, we wanted the most extreme population parameters where our sample would still be considered “likely” (either one of the highest or lowest of the likely sample means). That’s why we drew cutoffs at the upper and lower .025 of the relevant sampling distributions. In the picture above, you can see that the lower bound sampling distribution would have a .025 chance of generating an estimate higher than our sample estimate.
In the figure below, you can see what happens when the confidence interval is changed from 95% to 99%. Instead of marking the upper and lower .025 of the sampling distribution (the blue vertical line), we mark the upper and lower .005 of the sampling distribution (the yellow vertical line).
To construct the 95% confidence interval, we’ll add in the higher bound sampling distribution.
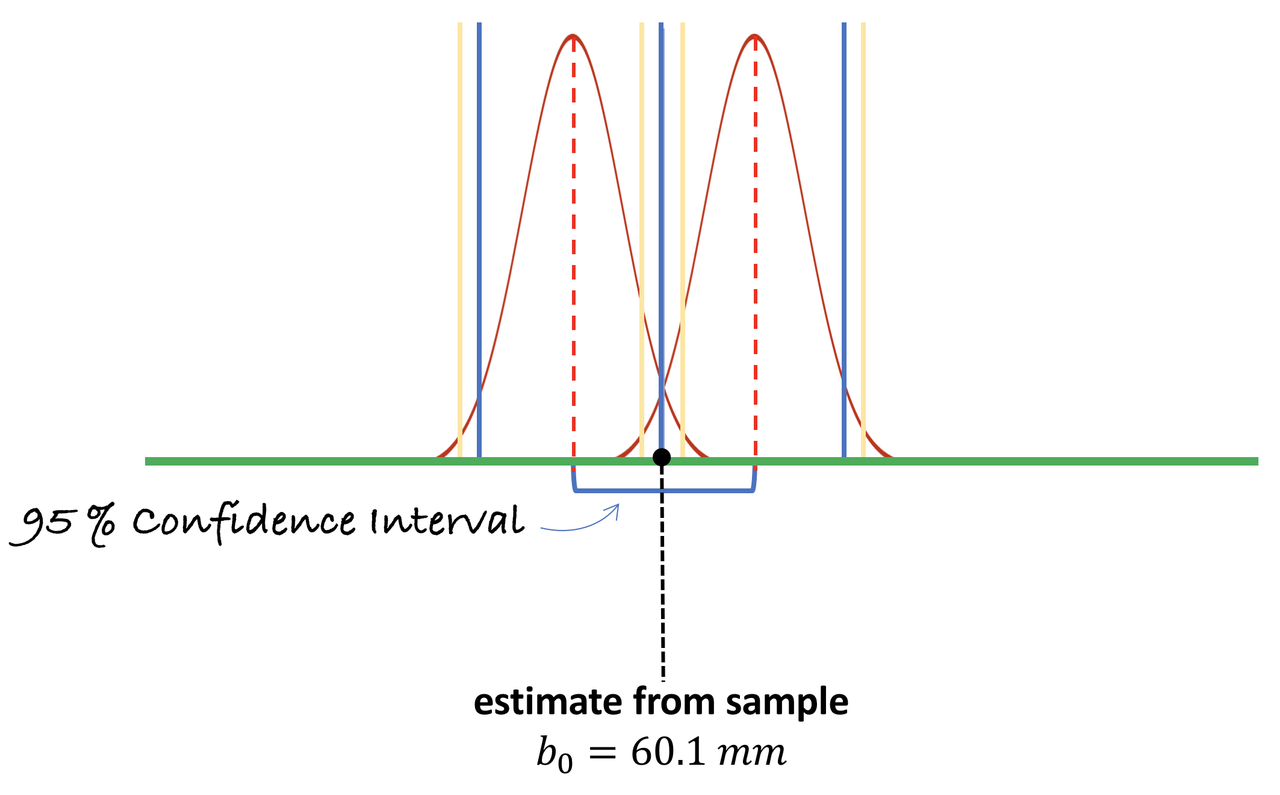
If our definition of “likely” was changed to 99% from 95%, we would have to push the lower bound down and the upper bound up (or, push the sampling distributions apart) to make our sample estimate fall right at the “unlikely” boundary. That way, our sample would fall on the yellow rather than the blue boundary.
To get the 99% confidence interval we must slide the upper and lower sampling distributions further apart so that the observed mean is now right at the .005 tails of each distribution. Watch what happens to the confidence interval when we do this—represented by the difference between the two hypothesized population means. They get further apart. So, if we want to be 99% confident that the population mean is within our confidence interval, we need to make the interval wider than if we only want 95% confidence.