Course Outline
-
segmentGetting Started (Don't Skip This Part)
-
segmentStatistics and Data Science: A Modeling Approach
-
segmentPART I: EXPLORING VARIATION
-
segmentChapter 1 - Welcome to Statistics: A Modeling Approach
-
segmentChapter 2 - Understanding Data
-
segmentChapter 3 - Examining Distributions
-
segmentChapter 4 - Explaining Variation
-
segmentPART II: MODELING VARIATION
-
segmentChapter 5 - A Simple Model
-
segmentChapter 6 - Quantifying Error
-
segmentChapter 7 - Adding an Explanatory Variable to the Model
-
segmentChapter 8 - Models with a Quantitative Explanatory Variable
-
segmentPART III: EVALUATING MODELS
-
segmentChapter 9 - Distributions of Estimates
-
segmentChapter 10 - Confidence Intervals and Their Uses
-
segmentChapter 11 - Model Comparison with the F Ratio
-
segmentChapter 12 - What You Have Learned
-
segmentFinishing Up (Don't Skip This Part!)
-
segmentResources
list full book
1.2 Doing Statistics With R
Speaking of doing, how are you going to do the data analysis part of this course? The answer is: you are going to use R (yes, it’s just called R, the letter). R is a free open source coding language commonly used by statisticians. Open source means that R was developed and is maintained not by a company but by a community of users. So basically, anyone can contribute to R and help make it better.
Why R?
Technology is a fundamental part of doing statistics these days. In fact, most of what we do in terms of data analysis would not be possible without computers, and most statistics courses include learning to use software for data analysis. There are many different software packages available. We chose to use R for two reasons: first, it’s free; second, it’s a coding language.
You may already know a bit about computer coding (or programming). But if you don’t, it’s worth demystifying it a little. Computers manipulate data rapidly and accurately—something we need to do in statistics. A coding language is the language we use for telling a computer what to do. It’s really that simple.
You may be thinking: coding language; that sounds hard! It may, in fact, be a little harder than just learning to use a statistics package with a point-and-click interface. But don’t worry: we will take you through it step by step, slowly. You might even enjoy it.
We want you to learn some R because we believe writing code will help you understand statistics better than simply clicking on buttons in a statistics package. And, it also will give you a skill at the end of this course that you didn’t have before! You can even put it on your resume (as in, “Basic knowledge of data analysis with R”).
Representing the same concept in different forms (called “re-representation”) helps make learning more robust. In this course, you will use a number of different representations: words, graphs, tables, mathematical notation, and R. Making connections between these different representations will deepen your understanding.
Try Some R Code
For example, here’s a bit of R (what we sometimes refer to as “code”). Read the code in the window below. What do you think it will do? Press the Run button and see what happens.
DATACAMP HINT: Click anywhere in the Script.R window and wait a few seconds for the dot next to the Submit button to turn green. Then go ahead and click Run. If DataCamp is not working (e.g., if you continually get the message Session Broken), go back to the First Things First page at the beginning of the book and review your technology setup. If you still can’t get it to work, click the ? in a blue circle in the lower right corner of this page to file a tech support ticket. This will also give you access to a knowledge base, including a searchable list of all R functions used in the book and the page on which they are first introduced.
print("Hello world!")
print("Hello world!")
ex() %>% check_function("print") %>% check_arg("x") %>% check_equal()
Look in the Console window. You can see that R displayed “Hello world!” Note: when we tell R to print(), R interprets that to mean, “Display in the console.” You just figured out a little bit of R.
IMPORTANT NOTE
When you press the Run button it will run the code in the script window. But to get credit for doing the assignment, and to get some feedback, you need to press the Submit button. Go back to the code window above and press Submit. This time you get the green bar and the words, “Good job!” Sometimes it displays “Well done!” or other supportive comments. Be sure to submit your final work with R by pressing Submit every time there is a Submit button available.
Let’s try another one. Read the code and see if you can guess what it will do. Then press the Run button in the window below.
sum(1,5,10)
sum(1,5,10)
            ex() %>%
                check_function("sum") %>%
                check_arg("...", arg_not_specified_msg = "Make sure you don't delete what's inside the parentheses.") %>%
                check_equal(incorrect_msg = "Make sure you don't change what's inside the parentheses.")
This bit of code printed out the sum of 1, 5, and 10 (that is, 16). You are already learning a bit of code.
The rectangular window that you just interacted with is called a coding exercise. Coding exercises are constructed to help you learn R without having to install anything or do anything special to your computer. You can just focus on learning R.
The Windows of R: script.R and R Console
In the DataCamp exercise, you’ll see a few different windows. The part where you type the code (that is, the instructions for what the computer should do) is called the script window. The window where the code actually runs, and where the results appear, is called the R console.
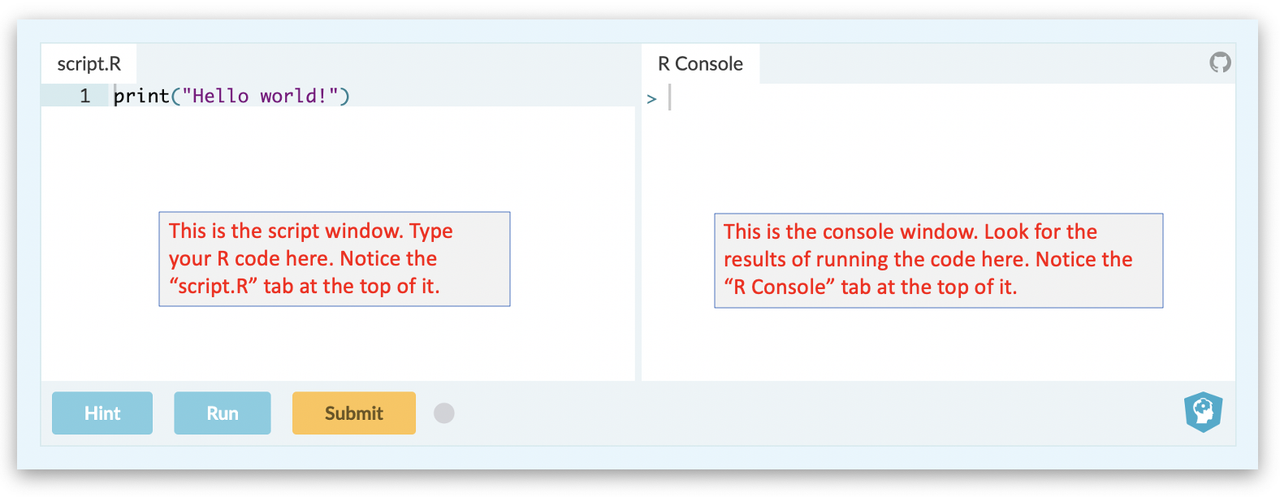
Throughout the course, type your R code into the script.R window. When you are done, press Run, and you will see R execute your instructions in the R console window. If you want you can type an instruction directly into the console (press enter to run). But you can only run one command at a time in the console, whereas you can enter a sequence of commands in the script window. We recommend you just type into the Script.R window for now.
You can re-size the script.R and R console windows. You may want to do that if the result of your R code is particularly wide. Simply drag the bar that separates the two windows:

Sometimes we will write things in script.R that we want R to ignore. These are called comments and they start with a #. R will ignore comments, and just execute the code. In this course we will use the comments as a way to give you instructions for R exercises. In the DataCamp window below, try typing whatever you want after a # at the front of the line. Then press Run.
            require(mosaic)
            require(tidyverse)
            require(ggformula)
            require(supernova)
            require(Lock5Data)
            require(Lock5withR)
            # type whatever you want
            # see... blah blah blah
ex() %>% check_code("#", fixed = TRUE)
Notice that you don’t see anything happen because the lines with # in the front are ignored by R.
If you want to write a comment that takes more than one line, it’s a good idea to put a # at the beginning of each line.
You can also use R like a basic calculator. Try running this code to see the results in the R console. Just press RUN.
            # a few basic arithmetic things
            5 + 1
            10 - 3
            2 * 4
            9 / 3
            # a few basic arithmetic things
            5 + 1
            10 - 3
            2 * 4
            9 / 3
            ex() %>% {
                check_operator(., "+") %>% check_result() %>% check_equal()
                check_operator(., "-") %>% check_result() %>% check_equal()
                check_operator(., "*") %>% check_result() %>% check_equal()
                check_operator(., "/") %>% check_result() %>% check_equal()
            }
Notice that you can put more than one line of code—or set of instructions—in a single script window. When you press the Run button, all the commands in the window will be run, one after the other, in the order in which they appear.
How to Learn the Most from DataCamp
The Run button will run your code in the DataCamp window. The Submit button will both run the code and submit your answer to be graded. You’ll learn the most by trying to write code, running it, and keep trying until it works. Once you know how it works, submit it for grading. There won’t always be a Submit button; in those few cases, your answer won’t be graded.
There is also a Hint button. Don’t be too fast to click the Hint button. You’ll learn more if you try on your own without the hint first. After you click the Hint button, you might see a Solution button. It’s tempting to look at the solution, but trust us, you won’t learn R unless you try writing code on your own.
The longer you try, even when it feels frustrating, the more you will learn.
Course Note: A DataCamp Sandbox is Always Available
We will always provide a code window when you need one. But, sometimes you may just want to try something out.
Go the the Resources folder and click on the page that says DataCamp Sandbox. This will open a page with an empty code window. This gives you a handy place to run some R code.
Click here to see the DataCamp Sandbox now.
DataCamp is a Stepping Stone to R in the Real World
In this online book we will run all of our R code in the DataCamp windows. DataCamp is great for learning R. But later, when you start doing actual data analysis projects, you will use different software tools. The two leading tools are RStudio and Jupyter Notebooks. Both are powerful tools, and both have advantages and disadvantages.
RStudio is an application that lets you write and run R code on your computer. It is an IDE (Integrated Development Environment). Jupyter Notebooks is a web application that can either be installed on your computer or on a server in the cloud.
It’s possible to install these applications on your computer but an easier route to getting started is to use a cloud service called DeepNote.com (which is free for students). DeepNote is kind of like Google Docs for Jupyter notebooks. If you are using Jupyter notebooks for this class, you can upload them to DeepNote and run them there. Or you can login to DeepNote and create a new notebook for running R.
To get started with DeepNote, check out the R in the Real World page in the Resources folder at the end of this online book.