4.6 Representing Relationships Among Variables
We’ve learned a lot of ways to visualize the relationship between an outcome variable and an explanatory variable, using color and fill, using gf_facet_grid(), using gf_point(), gf_jitter(), and gf_boxplot().
There are many ways to represent the relationship between the outcome and explanatory variables. We’ve learned how to make visualizations and write code that represents this relationship. We will introduce even more ways to represent these relationships. In this section, we will show you two: path diagrams, and word equations.
Building off the example we are now very familiar with, here’s a way to represent the relationship between Sex and Thumb:
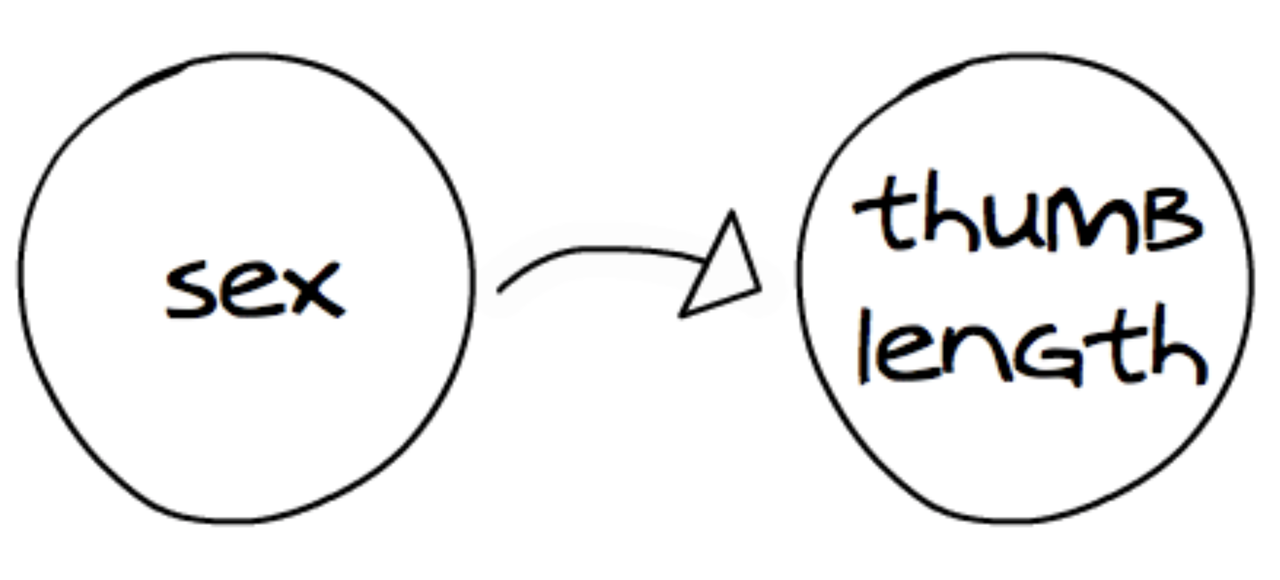
In path diagram convention, the explanatory variable “points to” the outcome variable. The direction of the arrow identifies Thumb as the outcome variable and Sex as the explanatory variable. So, we can read this diagram like this: “The variation in Thumb length is explained, at least in part, by variation in Sex.” It’s good to practice making diagrams like this. The same relationship is represented in the R code Thumb ~ Sex.
These path diagrams can be used to represent a relationship we have found in our data, or to one we hypothesize is true but that we have not yet investigated. Assuming we do have data to support it, we still can read it in two senses: as a relationship that exists in our data, or as a relationship that we believe exists in the world beyond our data, in the DGP.
A second way of representing relationships is with word equations:
THUMB = SEX
We can read this equation in the same way as a path diagram: “Variation in Thumb length is explained by variation in Sex.” A word equation is another way of representing relationships, real or hypothesized, in our data or in the DGP. By convention, the outcome variable, Thumb, is written on the left of the equal sign and the explanatory variable, Sex, is written to the right.
Note that this kind of equation is not the same as a mathematical equation. It doesn’t mean, for example, that thumb length and sex are the same thing, or that they represent the same quantity. It also doesn’t mean that the variation in thumb length is equal to the variation in sex. It simply means that some of the variation in thumb length is explained by variation in sex.
You may also notice that the equation is, in a sense, not true. Variation in thumb length is not fully explained by variation in sex. In the analyses we did above, we saw that even though some of the variation in thumb length appeared to be explained by sex, there is still plenty of overlap in the distributions of thumb length for males and females.
Another way of putting this is: just knowing the sex of a person will not enable you to perfectly predict their thumb length. There is a lot of variability within each group. So, obviously, sex is not the only variable that could explain variation in thumb length.
To represent this idea more clearly—and it is an important idea, as you will see later—we can add something to our word equation:
THUMB = SEX + OTHER STUFF
We can read this as: “Variation in thumb length is explained by variation in sex plus variation in other stuff.” In the next section we will discuss what this “other stuff” might be. But for now, it’s useful to think of the total variation in our outcome variable as the sum of variation due to an explanatory variable, plus variation due to other stuff.
We may also refer to these word equations as models. We will talk more about why we call them models later, but it’s helpful to start thinking of them as models.